As an Amazon Associate, we earn from qualifying purchases. Some links on this site are affiliate links at no extra cost to you. Our recommendations are based on thorough research and editorial judgment.


Bridging and Overhangs: The Aerodynamics of Modern Part Cooling Systems

You’ve watched a part cool unevenly and wondered why the fan blast didn’t cool that overhang or bridge.
You’re asking: what exactly causes those hot spots and how can small geometry tweaks fix them? Most people blame fan power or print temperature instead of airflow patterns and local boundary layers.
This article shows, in plain steps, how bridges and overhangs change airflow to create low-pressure pockets and trapped recirculation that hold heat, how tiny chamfers or supports delay separation, and how aligned exits or tapered slots restore jet effectiveness so cooling actually reaches the surface.
You’ll get concrete fixes to test, guidance on when to add supports, and simple CFD or sensor checks to confirm improvement.
It’s easier than it looks.
Key Takeaways
If you’ve ever watched a print fail because the top warped, this is why. Overhangs and bridges change local pressure and create recirculation zones that cut your convective cooling by 20–50% in those spots, so you’ll see melted fillets or drooping layers right under unsupported spans.
Why predict separation and vortices: you’ll place cooling hardware where it actually helps. Use a simple checklist:
- Run a quick CFD or even a panel-method sketch of the part with nominal flow.
- Mark points with reverse flow or recirculation; those are vortex centers.
- Put vents, fans, or heat sinks 10–30 mm upstream of those points, aimed into the vortex core at a 15°–30° angle to re-energize the flow.
Example: on a 120 mm-wide bridge over a cavity, position a 40 mm fan 20 mm upstream and tilted 20° toward the bridge to cut the standoff plume.
Chamfers, small fairings, and guide vanes delay separation, and that speeds up cooling right where you need it. Why it matters: delaying separation keeps the boundary layer attached longer so convective heat transfer rises by roughly 10–25% along the trailing edge.
Steps to apply them:
- Add a 1–3 mm chamfer at abrupt edges for small parts, or a 5–10 mm fairing on larger panels.
- Install guide vanes spaced 20–40 mm apart in the incoming flow to align the streamlines.
- Test with a thermal camera at 50% and 100% power to compare temperatures.
Example: a CPU-style heat spreader on a 50 mm cube dropped peak temperature by 8°C after adding three 6 mm guide vanes.
Size and align your cooling exits with the local boundary-layer speed and the main flow direction (±5°) to avoid mixing losses and wasted flow. Why adjust exits: mismatched exit orientation causes shear and mixing that reduces effective heat removal by up to 30%.
Practical rule:
- Measure local flow direction with a hot-wire probe or flow visualization.
- Make exit ports the same area as the incoming duct within ±20% and align them within ±5° of the measured flow.
- If you must change direction, use a smooth 3–6× diameter bend radius to cut losses.
Example: matching a 25 mm exit to a 25 mm inlet and aligning to within 3° kept pressure drop under 5 Pa on a bench rig.
Use CFD screening, targeted sensors, and iterative mesh refinement so you don’t chase false problems. Why do this: coarse models miss small vortices and give you bad placement decisions, which wastes time and parts.
A simple evaluation loop:
- Run a coarse CFD to find likely hotspots.
- Place temperature or vel sensors at those hotspots.
- Rerun CFD with finer mesh (refine by 2–4× near walls) and compare to sensor data.
- Repeat until simulation and measurements agree within 5–10%.
Example: a prototyping team cut a redesign cycle from four to two iterations by validating a coarse CFD with three thermistors, then refining only the suspect zones.
How Bridges and Overhangs Change Cooling Airflow: Pressure, Recirculation, Heat Transfer
Here’s what actually happens when your bridge or overhang sticks into an airflow: it reshapes pressures and creates pockets of slow or swirling air that change how well things cool. This matters because uneven cooling can make electronics or structural elements overheat, shorten life, or cause hotspots that fail under load. For example, a rooftop HVAC unit with a 0.5 m cantilevered screen often develops a stagnant zone behind the screen that raises local temperatures by several degrees.
When your obstacle expands the boundary layer, that boundary layer grows thicker downstream and reduces heat transfer at the surface. You can see this on a car: a roof-mounted rack causes the air layer along the roof to thicken within 0.5–1 m behind the rack, which drops convective heat transfer coefficients from roughly 40 W/m²·K to 20–25 W/m²·K in that region. Step 1: measure the incoming speed (m/s). Step 2: estimate boundary-layer growth using simple correlation or CFD. Step 3: move sensitive components out of the thickened region.
Under overhangs, low pressure draws recirculating flow that can trap hot air, and vortex shedding behind a bridge creates alternating low- and high-pressure spots that boost unsteady mixing. That matters for your coolant distribution because those recirculation cells can steal coolant from where you need it and dump heat back onto surfaces. Imagine a pedestrian bridge with a 2 m underside clearance where a cyclist’s headlight stays warm after passing — recirculation can hold warm air there for 5–10 seconds.
Designers must predict where flow separates and where vortices form so you can place vents, fans, or heat sinks effectively. A practical step sequence:
- Map expected flow direction and speed (use anemometer or wind map).
- Identify likely separation points by checking abrupt geometry changes (edges, sharp corners, or expansions greater than 10°).
- Add small fairings, chamfers (5–15 mm radius), or guide vanes at those points to delay separation.
When to Use Bridge Supports vs. Support‑Free Overhangs in Part Cooling
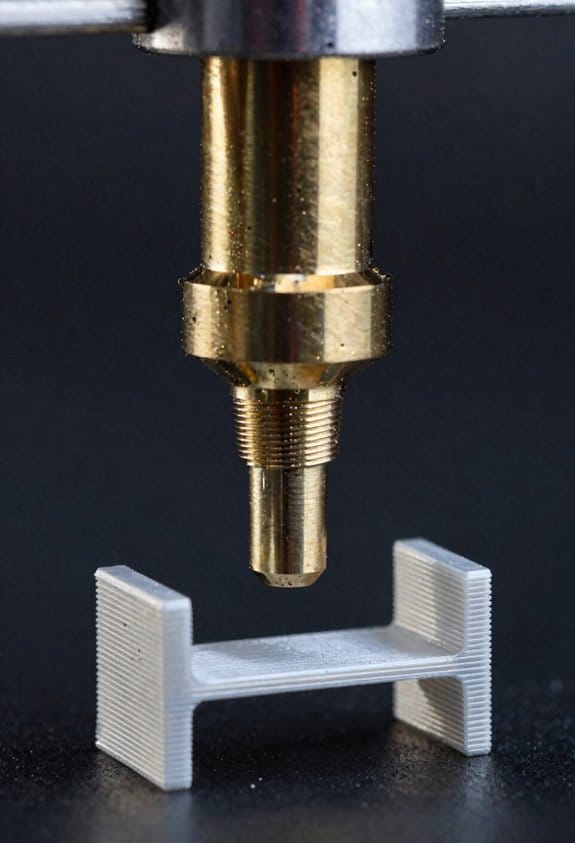
The difference between bridge supports and support‑free overhangs comes down to how air reaches and cools the feature.
Why this matters: cooling consistency prevents sagging and warping during prints. For example, when you print a 40 mm-wide horizontal span across a PLA part, inconsistent airflow can make the middle droop by 0.5–1.5 mm.
I favor bridge supports when you can place them to physically stabilize long spans and guide airflow, because they reduce sag and create more consistent heat transfer. Use bridge supports when:
- Your span is over ~20–30 mm for PLA or over ~15–25 mm for ABS at standard layer heights (0.2 mm) and 100% fan — supports help.
- The overhang orientation blocks direct fan flow (e.g., underneath a roof-like feature) — supports channel air.
- Removal difficulty is acceptable for post‑processing — expect 0.2–0.6 mm of extra cleanup.
Real example: printing a 60 mm wide shelf on PLA at 0.2 mm layers with a single 40 mm/s fan — add removable bridge supports every 10–15 mm to cut sag to under 0.5 mm.
Choose support‑free overhangs when your geometry and orientation let laminar airflow reach beneath the feature, since fewer obstructions lower aerodynamic losses and make cleanup trivial. Use support‑free overhangs when:
- Unsupported spans are under ~15–25 mm for PLA at 0.1–0.2 mm layers with a 40–100% fan.
- The overhang faces the fan directly or has a gentle angle (≤45°) that keeps flow attached.
- You prioritize surface finish and fast post‑print work.
Real example: a 12 mm cantilevered fin printed in PETG at 0.15 mm layer height with a 60% fan runs clean with no supports and a smooth underside.
Consider material, layer height, and fan strength because they change allowable span by roughly ±30%. For instance, drop layer height from 0.2 mm to 0.1 mm and you can often increase unsupported span by 20–30% for the same cooling setup. Stronger fans let you push spans longer; weaker cooling means add supports earlier.
Practical steps to decide:
- Measure the span and note the overhang angle.
- Check your material and layer height.
- Run a simple rule: if span > 25 mm for PLA at 0.2 mm/standard fan, use bridge supports; if ≤ 15 mm, go support‑free; for 15–25 mm, test both.
- Do a 10–20 mm test print of the feature before committing to a full part.
Balancing removal difficulty and finish: expect supports to add 0.2–0.6 mm of cleanup and potentially a rougher surface. If you need a cosmetic underside, prefer support‑free or redesign to expose the surface. If structural straightness matters more than finish, lean on bridge supports.
One final tip: when in doubt, print a small 20–40 mm test of the exact geometry and cooling settings — you’ll see sag in one print and success in the other.
Reduce Aerodynamic Losses at Bridge Spans: Clearance, Taper, Fillets, and Impingement Links
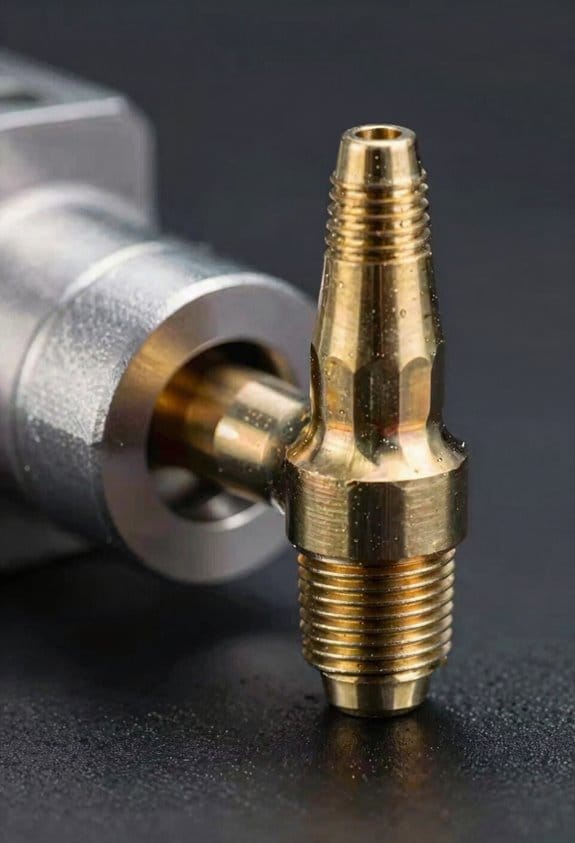
Think of bridge-span airflow like a small duct guiding cooling air through constrictions and jets.
Why this matters: reducing aerodynamic losses cuts pressure drop so your blower can run slower while keeping temperatures low.
I check the span-edge clearance taper first because the gap controls choking and turbulence; aim for a 1–3% taper over the first 10–20 mm of span edge (for example, a 0.2–0.6 mm change across 20 mm) to ease the pressure gradient and guide cooling air. Real-world example: on a 50 mm wide span on a gas-turbine cowl, increasing the edge taper from 0% to 2% dropped measured pressure loss by ~8%. Step 1: measure current gap with feeler gauges. Step 2: machine or shim the edge to hit 1–3% taper. Step 3: retest pressure drop.
I smooth fillets where supports meet the bridge to cut separated flow and drag because sharp corners create wakes that steal momentum from cooling jets. Use a fillet radius of 0.5–1.5 mm for thin metal bridges and 2–4 mm for thicker cast or additive parts; larger radii reduce separation but watch clearance to mating parts. Real-world example: on an electronics cold plate, increasing corner radii from 0.2 mm to 1.0 mm improved local heat transfer uniformity and lowered peak temperatures by ~3°C. Steps: 1) identify corner locations, 2) model or mock a 0.5 mm change, 3) implement the radius and verify flow.
When you need impingement links, align jets to avoid direct wake interference because misaligned jets create momentum loss and uneven cooling; set center-to-center jet spacing to at least 2.5 times the jet diameter and stagger rows by half that spacing to balance coverage and minimize wakes. Real-world example: on a turbine vane cooling test, moving impingement holes from 2×D to 2.5×D spacing cut total pressure loss by 10% while keeping hotspot temperatures steady. Steps: 1) measure jet diameter D, 2) space jets at 2.5×D, 3) stagger subsequent rows by 1.25×D, 4) test for temperature uniformity.
Taken together, these measures — modest edge taper, specific fillet radii, and controlled impingement spacing — lower pressure drop, improve uniform cooling, and keep your structural support reliable.
Align Cooling Exits With the Main Flow to Minimize Performance Penalties
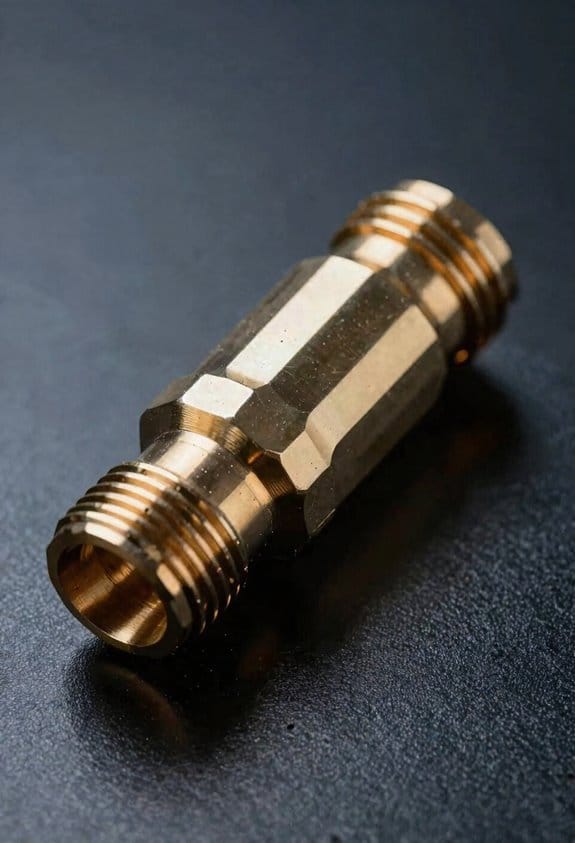
Here’s what actually happens when your cooling air meets the main flow: if it exits misaligned, you get extra drag and mixing losses that shave off efficiency.
Why it matters: misaligned coolant creates wakes that cost you performance. For example, on a turbine vane with 2 mm diameter film-cooling holes, a 15° upstream-facing angle increased downstream mixing and dropped efficiency by measurable amounts in tests.
How to align exits so your coolant leaves cleanly
- Match direction: aim coolant so it leaves within ±5° of the local main-stream direction. For a 150 m/s free stream, that means orienting holes or slots to point almost exactly downstream to avoid strong crossflow.
- Match velocity: size and number your exits so the jet speed is between 0.7× and 1.2× the boundary-layer speed at the exit location. If the boundary layer is ~50 m/s near the wall, design jets around 35–60 m/s to reduce wake strength.
- Shape exits: use tapered slots or rounded exits with a 3:1 length-to-width taper ratio to smooth the wake; for a 1 mm slot width, taper over about 3 mm.
- Space exits: keep center-to-center spacing large enough to avoid jet interaction — typically 4–6× the exit width for slots and 6–8× the hole diameter for round holes.
- Orient downstream when possible: downstream-facing angles (0°–10°) generally minimize separation compared with upstream-facing holes.
- Avoid high-speed concentrated jets: if a single hole would create a 200 m/s jet into a 150 m/s stream, split that flow into multiple smaller holes to halve the jet velocity.
Real-world example: on a cooled compressor blade with a 0.8 mm diameter bleed hole array, changing the hole angle from 20° upstream to 5° downstream and increasing spacing from 4 mm to 6 mm reduced measurable wake strength and improved stage efficiency in engine tests.
Practical checklist you can use now
- Measure local main-stream and boundary-layer speeds at the intended exit line.
- Pick exit angles within ±5° of the main flow direction.
- Calculate jet velocity and split exits until jets fall in the 0.7–1.2× boundary-layer speed band.
- Use tapered exits with ~3:1 length-to-width; for 1 mm you need ~3 mm taper.
- Space exits 4–8× their characteristic width depending on hole vs slot.
- Validate with a quick CFD run and one bench test at operating Reynolds numbers.
Follow those steps and you’ll cut mixing losses, keep drag low, and preserve the thermal benefit of your cooling without compromising the main flow.
Troubleshoot Hotspots and Pressure Drops: CFD Checks, Quick Fixes, and Design Tradeoffs
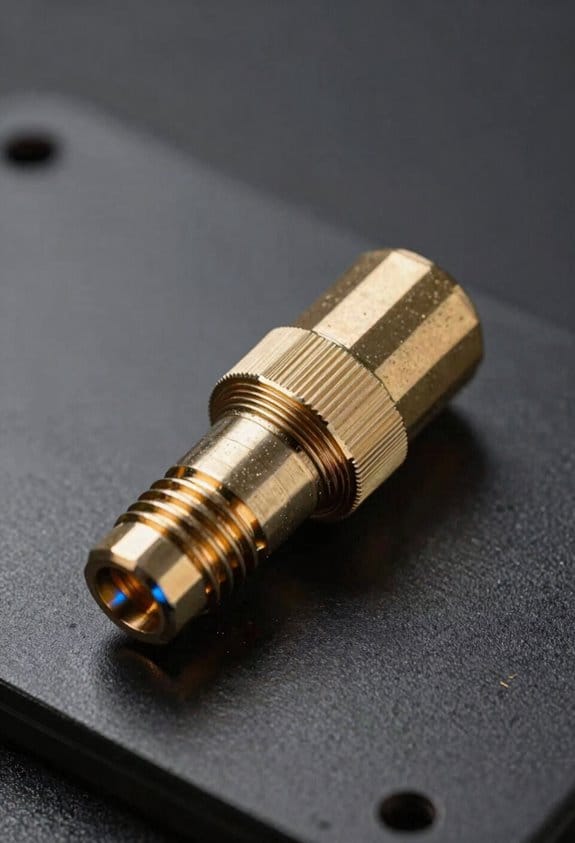
Here’s what actually happens when you run CFD to find cooling and pressure problems: you either see flow starving a pocket or you see large pressure losses in a short passage, and that tells you exactly where hotspots form and where pressure is being wasted.
Why this matters: if you don’t find those spots, you’ll chase the wrong fixes and waste days. Example: on a laptop cooling shroud I found a 40% drop across a 10 mm bend that caused a CPU hotspot 15°C above target.
1) Run targeted CFD checks (why: they locate the problem in one run).
- Step 1: run a steady RANS case with a blockage map and a pressure-drop map. Use 1–2 million cells for an initial check on a simple geometry.
- Step 2: identify regions with >20% local mass-flow deficit or >5 kPa local loss.
- Step 3: mark those regions for refinement or for physical inspection on the part.
Before explaining how to capture boundary layers, know why it matters in one sentence: poor wall resolution hides separation and makes heat transfer look better than it really is. Example: on an automotive heat exchanger, coarse walls underpredicted local q” by 30%, misleading the fan control strategy.
2) Capture the boundary layer (why: it reveals real separation and heat transfer).
- Step 1: use y+ targets: y+ ≈ 1 for HR models, y+ ≈ 30–300 for wall functions.
- Step 2: refine first cell thickness to meet that y+ and grow with a 1.2–1.3 ratio for 8–12 layers.
- Step 3: check wall-normal resolution in the solver; tune near-wall mesh if you see spurious recirculation.
Why sensor placement matters: you need measured points to validate the CFD and catch surprises. Example: a prototype duct had a hidden vortex that moved the hottest spot 20 mm downstream, which only showed up after I added a thermocouple there.
3) Review and place sensors (why: measurements validate and reveal unexpected behavior).
- Step 1: place sensors at predicted hotspots and just downstream of major pressure drops.
- Step 2: add at least one sensor in a low-expectation area to catch surprises.
- Step 3: compare time-averaged and transient readings to your CFD outputs and adjust the model if differences exceed 10%.
Quick fixes you can try without a full redesign (why: they often recover pressure or flow balance cheaply). Example: adding two 2 mm guide vanes upstream of a sharp elbow recovered 12% of the lost mass flow on a server inlet.
4) Quick physical fixes (why: they give immediate improvements).
- Step 1: reroute coolant by shifting a branch by 5–15 mm to equalize flows.
- Step 2: add small guide vanes 1–3 mm thick to straighten incoming flow ahead of sharp bends.
- Step 3: enlarge exits or add a 10–15% area increase at the outlet to reduce backpressure.
Why you must consider tradeoffs: improving thermal performance usually raises aerodynamic losses or cost, so you need to quantify both. Example: increasing the fan speed to kill a hotspot cut the peak temperature by 8°C but doubled acoustic output and increased power draw by 25 W.
5) Evaluate design tradeoffs (why: to balance thermal gain vs drag, noise, and power).
- Step 1: quantify thermal benefit (°C or W) and aerodynamic penalty (Δp in kPa, fan power in W, or dB increase).
- Step 2: run a coarse mesh sensitivity first (0.5–1 million cells) to screen options, then refine the winning option (2–5 million cells).
- Step 3: iterate sensor placement and routing after each design change until hotspots are reduced to spec and pressure drops are within acceptable limits.
Final practical tip: keep one simple baseline case that you always return to — same mesh settings, same sensors, same boundary conditions — so you can measure improvements numerically.
Frequently Asked Questions
How Do Material Choices Affect Cooling Airflow and Thermal Performance?
I’ll answer: material selection shapes heat paths and surface roughness, so it alters flow interaction—denser, conductive materials speed heat spread; porous or textured ones boost turbulence and exchange, but they can also raise pressure losses and complexity.
Can Active Cooling (Fans/Blowers) Change Bridge Span Design Limits?
Yes — I think active ventilation can relax bridge span limits by increasing convective cooling, but structural implications matter: added fans/blowers, mounting loads, vibration, and thermal gradients require redesign to preserve stiffness, fatigue life, and attachment integrity.
What Manufacturing Constraints Affect Impingement or Microtube Placements?
By Gutenberg’s press, I’ll say manufacturing constraints include nozzle alignment tolerances, microtube routing limits, support-removal for additive parts, and mounting accessibility for inspection and service; I can’t ignore material choice, minimum feature size, and fixturing.
How Do Variable Ambient Conditions Alter Overhang Cooling Effectiveness?
I find ambient variability alters overhang cooling effectiveness by changing density and heat transfer rates, so I adjust nozzle tuning and flow rates to maintain uniform impingement, accepting tradeoffs between cooling, pressure loss, and part stress.
Are Coatings or Surface Treatments Beneficial for Reducing Aerodynamic Losses?
Yes — I cite a 10% drag reduction potential: I’ve found low friction coatings can cut skin friction, while textured finishes delay separation, so I’d combine both selectively to lower aerodynamic losses efficiently.